


Lung Cancer
Lung cancer is the third most common cancer and the leading cause of cancer deaths in the United States.
Nodule Localization and Biopsy Guidance
In 2011, results published from the National Lung Screening Trial (NLST) showed that people at high risk for developing lung cancer (55 to 74 years of age with a history of heavy smoking) are 20 percent less likely to die from lung cancer if they are screened with low dose helical computed tomography (LDCT) than with standard screening chest x-rays. Medicare in the US recently implemented a LDCT screening program for high-risk individuals and several other countries are expected to follow.
Although LDCT can detect malignant pulmonary nodules that are occult to chest radiographs, the vast majority of these nodules (>96%) are benign. With the deployment of LDCT-based lung cancer screening programs, the detection of pulmonary modules as a radiographic finding on CT scans is becoming increasingly common and its frequency is likely to increase in the future.
All suspicious nodules identified on CT must be further investigated – either confirming the diagnosis or ruling out malignant potential. We are investigating the use of OCT and OCT-AFI to improve the localization and guide biopsy of suspicions nodules identified during CT. Electromagnetic navigation and virtual bronchoscopy can guide the clinician to the correct airway for biopsy collection, however, these navigational tools often do not have sufficient accuracy to guide collection from very small (<1cm) nodules.
We are investigating the use of OCT-AFI for guiding biopsy collection to supplement radial endobronchial ultrasound (R-EBUS). OCT-AFI has superior resolution and the catheters can be made smaller to reach more peripheral nodules.
In addition, OCT-AFI enables the detection blood vessels using either Doppler OCT (DOCT) or vascular maps generated by AFI. This enables the discrimination of nodule from vessel when selecting a biopsy site – something that can be challenging using R-EBUS.
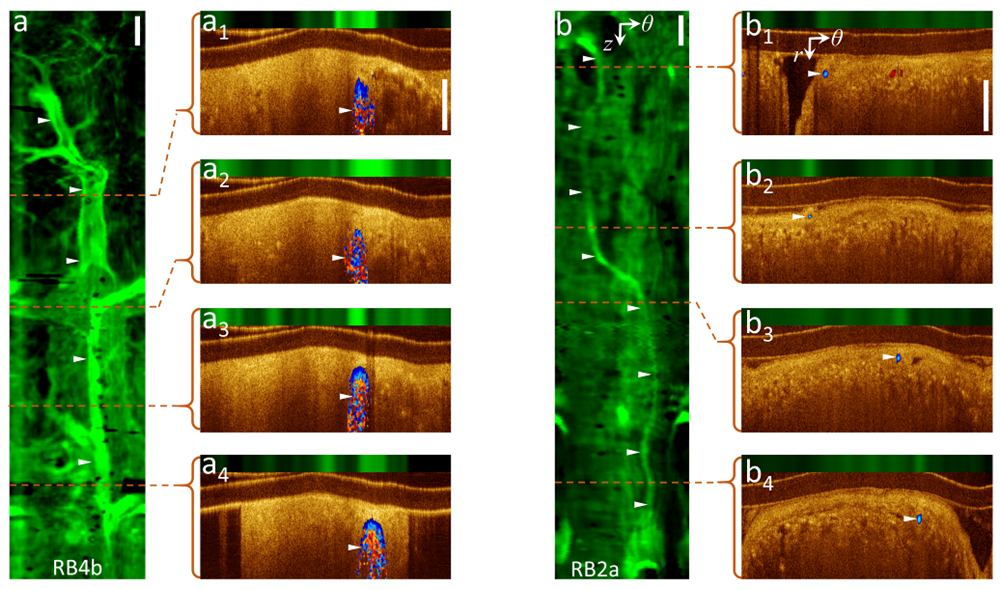
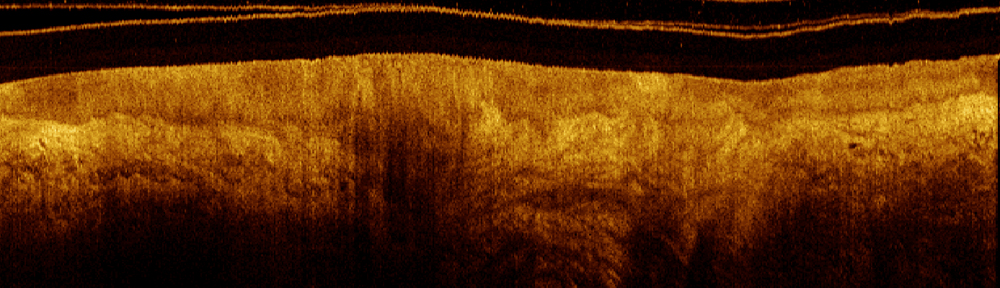
The figure shows vascular network visualization by AFI with confirmation by DOCT: (a, b) AF z–θ maps of pullbacks from airways RB4b and RB2a, (a1-4, b1-4) cross-sectional DOCT-AFI frames in polar coordinates (r, θ) corresponding to the red dashed lines along the pullbacks. ► indicate vessel locations. Scale-bars are 1mm.